Here is a quick look into the new debugging environment in ALBPM 6.0. The flow itself is for the most part similar to 5.7, with a few Eclipse related nuances. Check it out.
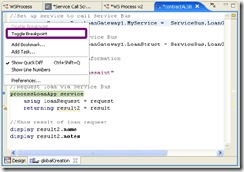
After a business user has defined a business process, developers can start integrating services using Studio. Much like a typical IDE you can make use of break points and other debugging features. Just right click on the code window and the contextual menu will show up. There you will see an option to Toggle Breakpoints as seen in the image below.
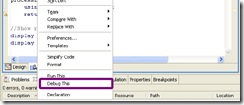
When you are done adding break points right click on the code panel and from the contextual menu select the option to "Debug this", see next image. From there you will be placed in debug mode and the debug session will start.
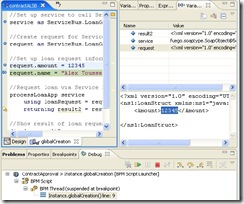
Immediately after you get into debugging mode, you will notice two new tabs present under the code panel. One is the "Breakpoint" tab with a list of all your break points. The other tab is the "Debug" tab, with your typical options to run, stop, run over, run into, etc.
Next, as you start to run through the code you will see variable declarations being updated on the right panel. You can also see the execution arrow making progress in your code panel on the right side. The line being executed will have a blue arrow pointing to it, as shown below:
As you can see debugging with ALBPM 6.0 is very simple and straight forward. The flow is very similar to 5.7, but now you are running in the Eclipse environment. BTW, if you are moving to 6.0 be sure to get Maintenance Pack 1 - just came out.
Cheers,
--alex
PS: Now to the Bonus Material...
If you made i this far I would like to share with you some pictures from Fleet Week in San Francisco taken this past weekend. Below are some shots from the Blue Angels flying around the bay.

Technorati tags: BPM Business Process Management SOA BEA Java WS Web Services Blue Angels


No comments:
Post a Comment